With 2011-12 marketing year-ending stocks of U.S. corn expected to be near pipeline levels, the size of the 2012 crop has substantial price implications. Acreage intentions will be revealed in the USDA's March 30 Prospective Plantings report, but much of the current discussion centers on prospects for the U.S. average corn yield.
 Widely differing views of yield prospects for 2012 have emerged. A number of factors may contribute to the diverse views, but four have received a lot of attention. These include (1) the timing of planting, (2) the magnitude and potential change in the trend yield, (3) the expected summer weather conditions, and (4) the location and magnitude of acreage changes.
The mild winter weather and early spring fieldwork suggests that the 2012 crop will be planted in a very timely fashion. There is a general perception that early planting results in a higher U.S. average yield potential, all other things being equal.
Agronomic research in the Corn Belt reveals a slight yield penalty for extremely early planting (March), a wide planting window for maximum or near maximum yield potential (early to mid-April through early May), and a yield penalty for late planting that increases with the lateness of planting.
While there is a clear yield penalty for late planting, there is not a similar yield premium for early planting. The majority of the crop is planted in the optimum window in most years.
To have an effect on U.S. average yield potential, a substantially larger or smaller portion of the crop would have to be planted outside the optimum window. For 2012, a smaller-than-average percentage of the crop planted late might increase yield potential, but that impact would be quite small.
Widely varying opinions about the trend in U.S. average corn yields have emerged in recent years. The long-term increase in average yields is associated with the development and adoption of crop production technology and crop management practices. The nature of those developments has varied over time, but there has been a steady flow of yield-enhancing technology and practices.
For the most part, variation around the trend yield reflects variation in growing season weather, although events such as pest infestations or early occurrences of freezing temperatures can have a yield effect. Confusion about the yield impact of technology and weather can occur if there is a string of years with very favorable or unfavorable weather. In that case, the impact of weather can mistakenly be attributed to technology and give the impression that the underlying trend yield has
changed.
That appeared to have happened from 2003 through 2009 when generally favorable weather led some to believe that the underlying trend yield was increasing at a faster rate. The reverse may have occurred recently; poor weather in 2010 and 2011 resulted in low yields following the record yield of 2009. Overall, evidence suggests that the trend in U.S. average corn yields has been linear since
1960.
U.S. corn plantings are expected to increase by 2 to 3 million acres in 2012. It has been argued that the increase will occur in lower-yielding areas and therefore prove to be a drag on the U.S. average yield. The most logical expectation is for an average yield near the long-term trend. The trend yield for 2012 is just under 160 bushels per acre. The USDA's early forecast for 2012 is for a yield of 164 bushels.
With harvested acreage projected at 87 million acres, a 4 to 5 bushel difference in the U.S. average corn yield represents a difference of 350 to 435 million bushels in crop size. Prospects of an average yield near 160 bushels would suggest that new-crop corn prices are probably low enough, while prospects for a yield of 164 bushels or higher would likely push prices marginally lower.
Source: Darrel Good, University of Illinois agricultural economist
217-333-4716
Farm Supply
Tractors
Farm Magazines
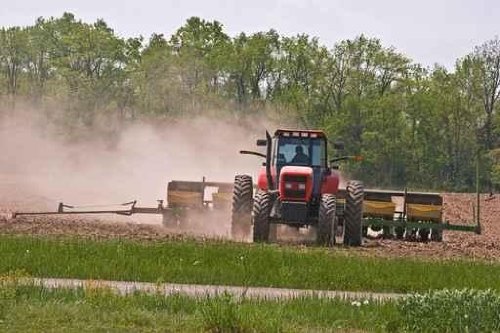
Artwork: Tractor Planting Corn